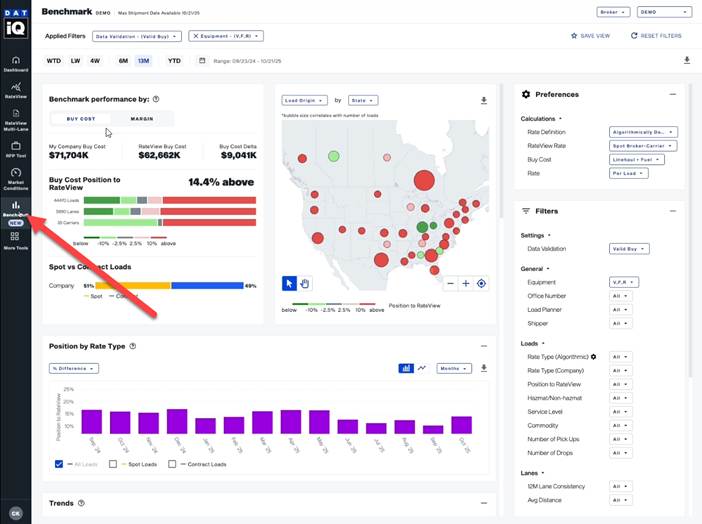
iQ Benchmark is an analytics tool within the IQ Platform, designed to help broker customers evaluate performance against market data. You can access it from the left-hand navigation bar in the IQ interface.
iQ Benchmark currently supports two primary analytics use cases:
- Comparing your buy cost versus the RateView rate
- Evaluating your margin (sell rate vs. buy cost)
These insights allow for both managerial reporting and deep-dive analytical exploration.
Benchmarking Buy Cost
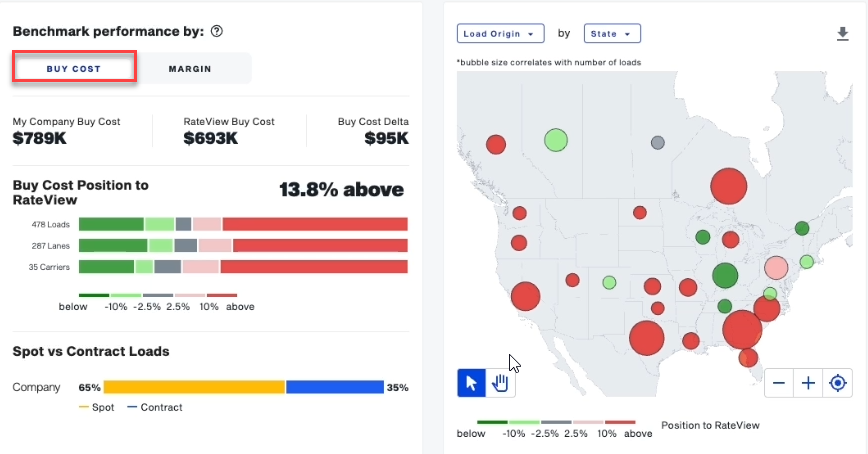
When you select the Buy Cost setting, Benchmark compares your aggregated buy cost data to the RateView rate.
You’ll see:
- Delta Cost – The total dollar difference between your buy cost and the RateView rate
- Position – Whether your cost is above or below the market rate
This data is driven by your organization’s contribution data, allowing you to visualize how your costs compare to broader market trends.
Common Use Cases
- Managerial Reporting :View weekly or monthly performance to share with your organization.Example: Generate a report showing last week’s buy cost vs. RateView rate.
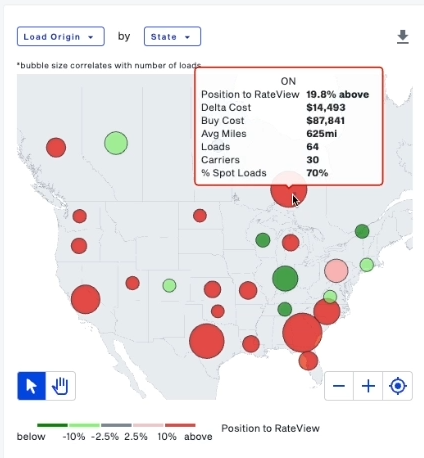
- Drill-Down Analytics: Explore your data by region, lane, carrier, or load planner.For example, you can:
- Drill into a specific market.
- Identify which load planners are performing above or below market.
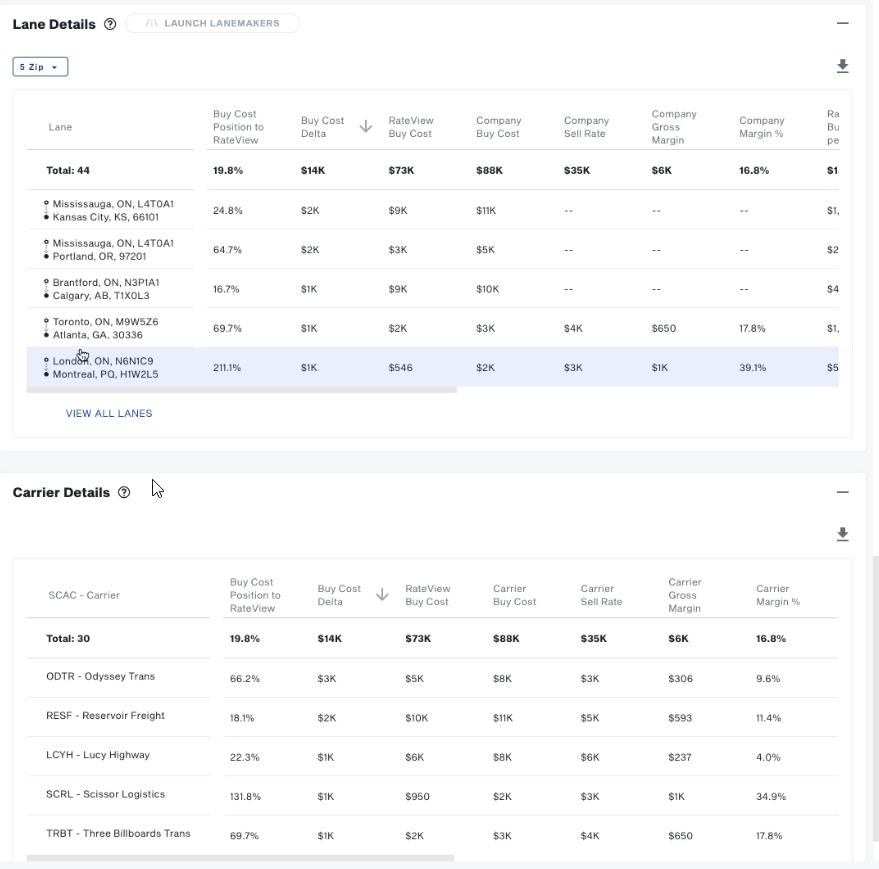
- Review lane-level and carrier-level details.
- Drill into a specific market.
Data Insights
Within the drill-down views, you’ll find:
- Sell rate, margin, average miles, number of loads, carriers used, and more
- Blank fields indicate missing data in your contribution dataset (e.g., carrier name, shipper name, office number, load planner).
Tip: The Load Planner field is the most commonly used filter and highly useful for performance tracking.
Benchmarking by Margin
The Margin setting compares your sell rate to your buy cost, displaying the resulting company margin both in dollar and percentage form.
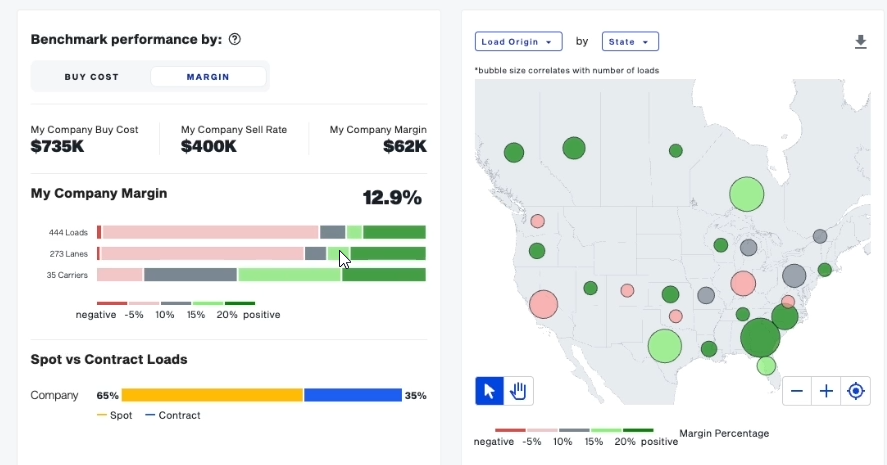
Visual Indicators
Throughout the application, a color legend helps you quickly interpret performance:
- Gray: Average margin (around 13%)
- Green: Above average
- Red: Below average
You can immediately see:
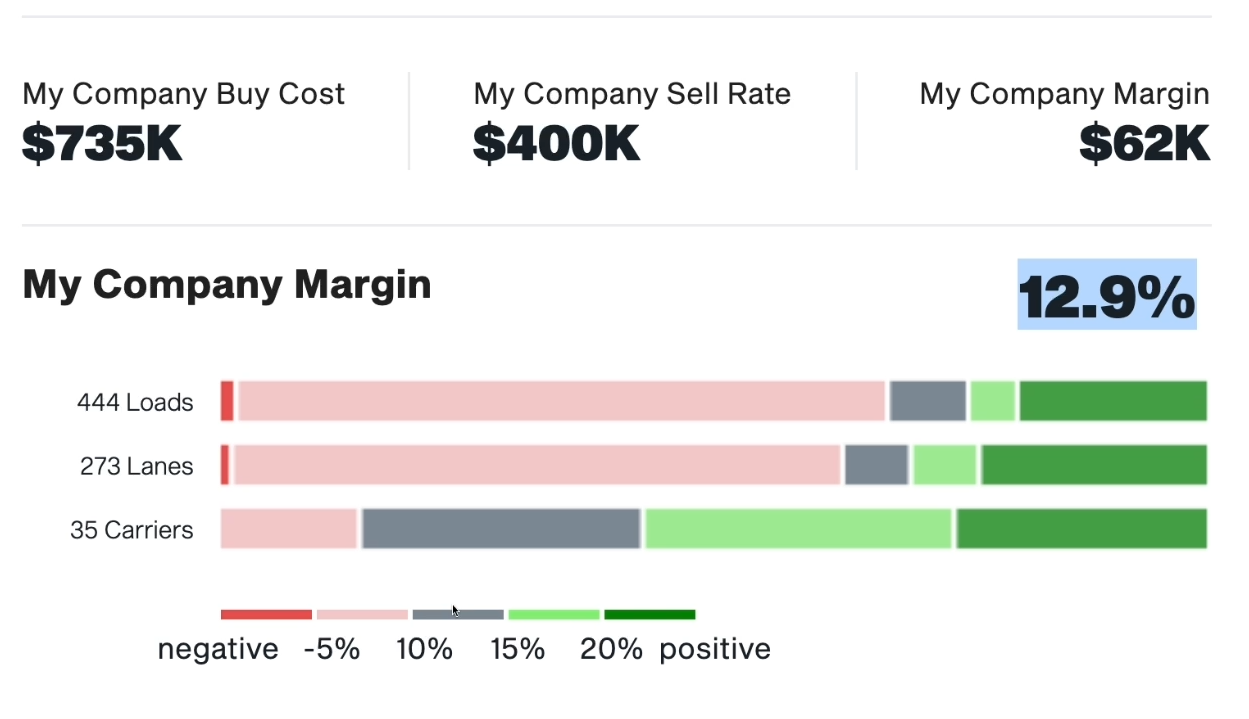
- The number of loads, lanes, and carriers in your current filter set
- Which segments are performing above or below expectations
Trend Analysis
Use the trend charts to monitor performance over time:
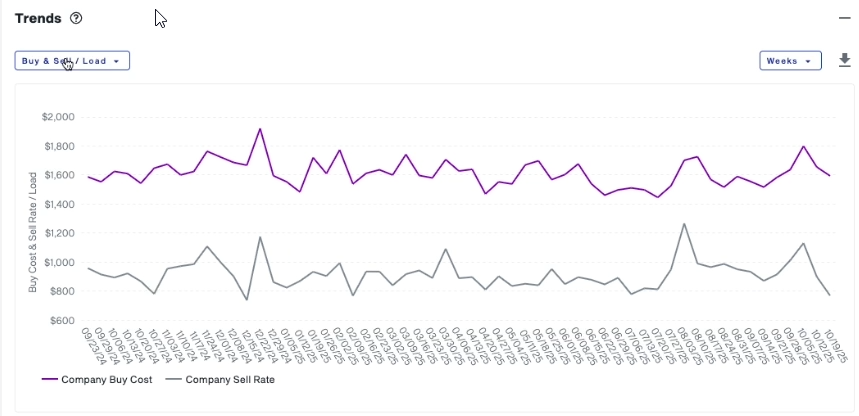
- Track your buy cost, sell rate, or margin over the last 13 months
- Identify trends in gross margin or market position relative to RateView
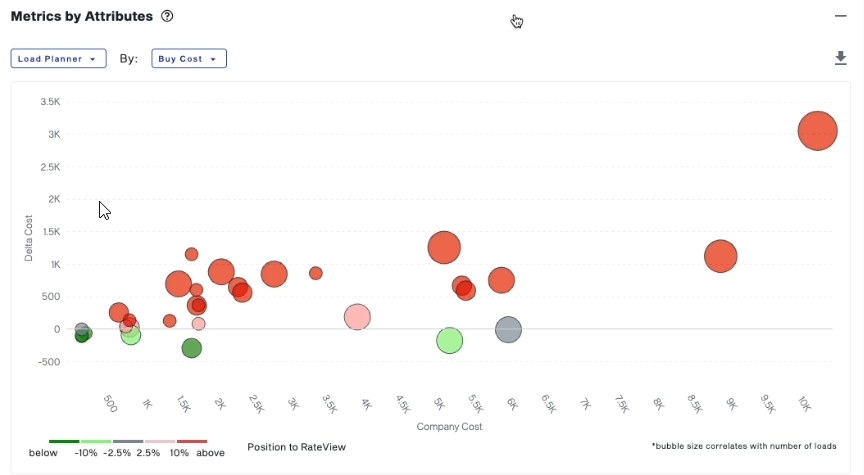
Bubble Chart
The bubble chart view allows for root cause analysis and opportunity discovery.
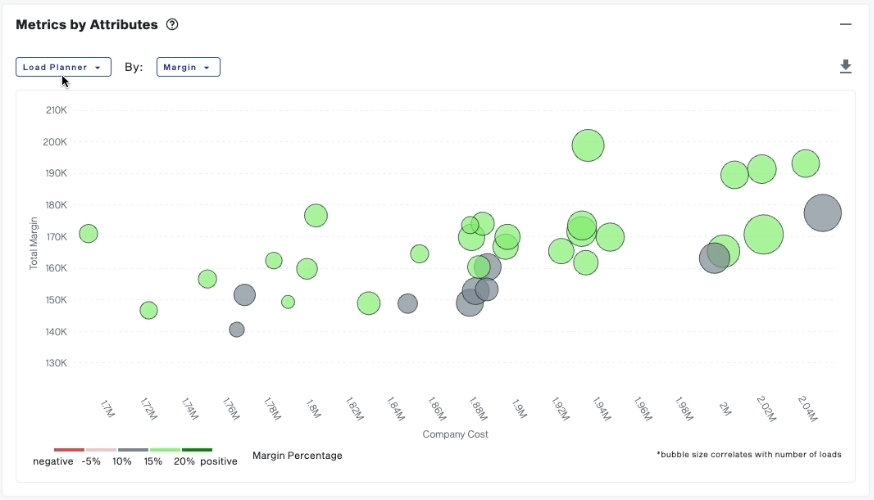
You can visualize:
- Total margin (vertical axis) vs. company cost/freight spend (horizontal axis)
- Margin performance using the same color-coded legend
Switch between:
- Margin by Load Planner
- Benchmark vs. RateView
Use this chart to uncover:
- Areas to reduce cost or increase sell rate
- Markets or planners with the greatest potential for improvement
- Opportunities to shift volume strategically between segments
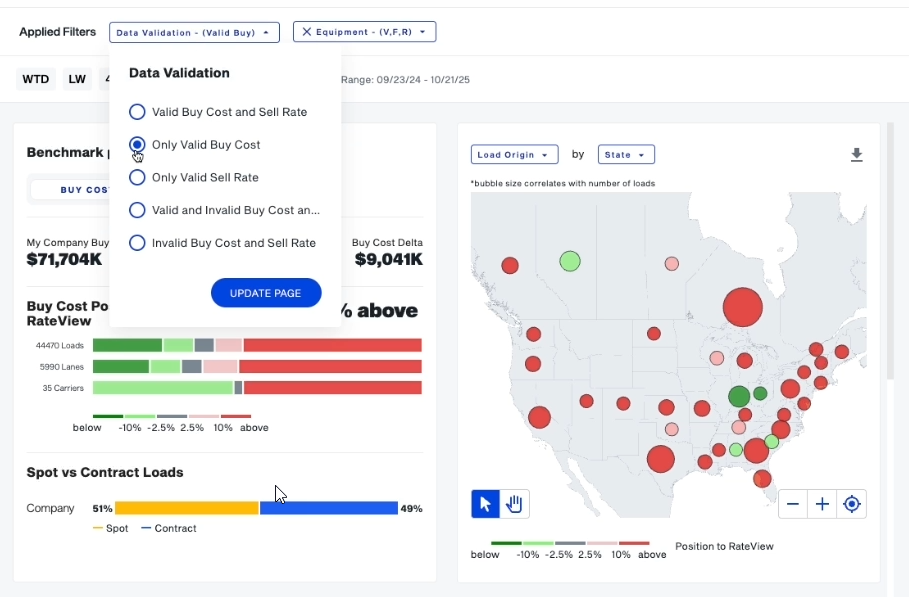
Data Validation and Downloads
Benchmark includes data validation tests (explained in a separate video) to ensure accuracy.
You can also download your full load-level detail at any time using the Download option in the upper right corner of the screen.